UX/UI Case Study
ESG Booster
Is a portfolio analysis platform that helps advisors lift ESG ratings with minimal disruption by recommending alternative holdings that respect each client's preferences, then packaging the rationale into an advisor-ready report.
Role
Senior product designer
Client
Synechron
Project
Innovation Lab Accelerator
Platform
Web Application
Domain
Wealth & Asset Management
Overview
Sustainable investing, without rebuilding the portfolio
ESG Booster analyzes a portfolio across Environmental, Social, and Governance metrics, benchmarks it against major ESG indexes, and proposes an "alternative portfolio". A set of targeted swaps that improve the ESG rating while staying true to the client's sector preferences, risk tolerance, and investment goals.
Advisors can review the recommendations, adjust constraints, and export a report to take into the next client conversation for discussion or approval.
My Role
Discovery & Strategy
Interviewed portfolio managers and ESG specialists to map the analysis workflow, decision points, and the constraints that shape "acceptable" trades.
Interaction & Visual Design
Designed the simulator dashboard, comparison views, and reporting flow — translating dense ESG data into glanceable, advisor-friendly views.
Prototyping & Validation
Built interactive prototypes for stakeholder reviews and usability sessions inside the Synechron Innovation Lab Accelerator.
The Problem
ESG data is everywhere. However, actionable answers aren't
Advisors are increasingly asked by clients to "make my portfolio more sustainable" but the path from intent to action is messy. ESG scores from different providers disagree. Index benchmarks vary by methodology. And any change to holdings has to respect the client's existing preferences, sector exposure, and risk profile.
Most tools surface scores. Very few help an advisor decide what to actually do next and even fewer can defend that recommendation in a client meeting.
Reframing The Problem
From "rate this portfolio" to "improve this portfolio"
Before: Score-First Tools
Advisors pulled ESG scores from one vendor, manually compared against another, and built spreadsheets by hand.
Recommendations relied on memory and instinct, with no audit trail for why a holding was swapped.
Client preferences (e.g. "no tobacco", "keep energy exposure") lived in CRM notes, disconnected from analysis.
Reports were assembled in slides with hours of work per client review.
After: ESG Booster
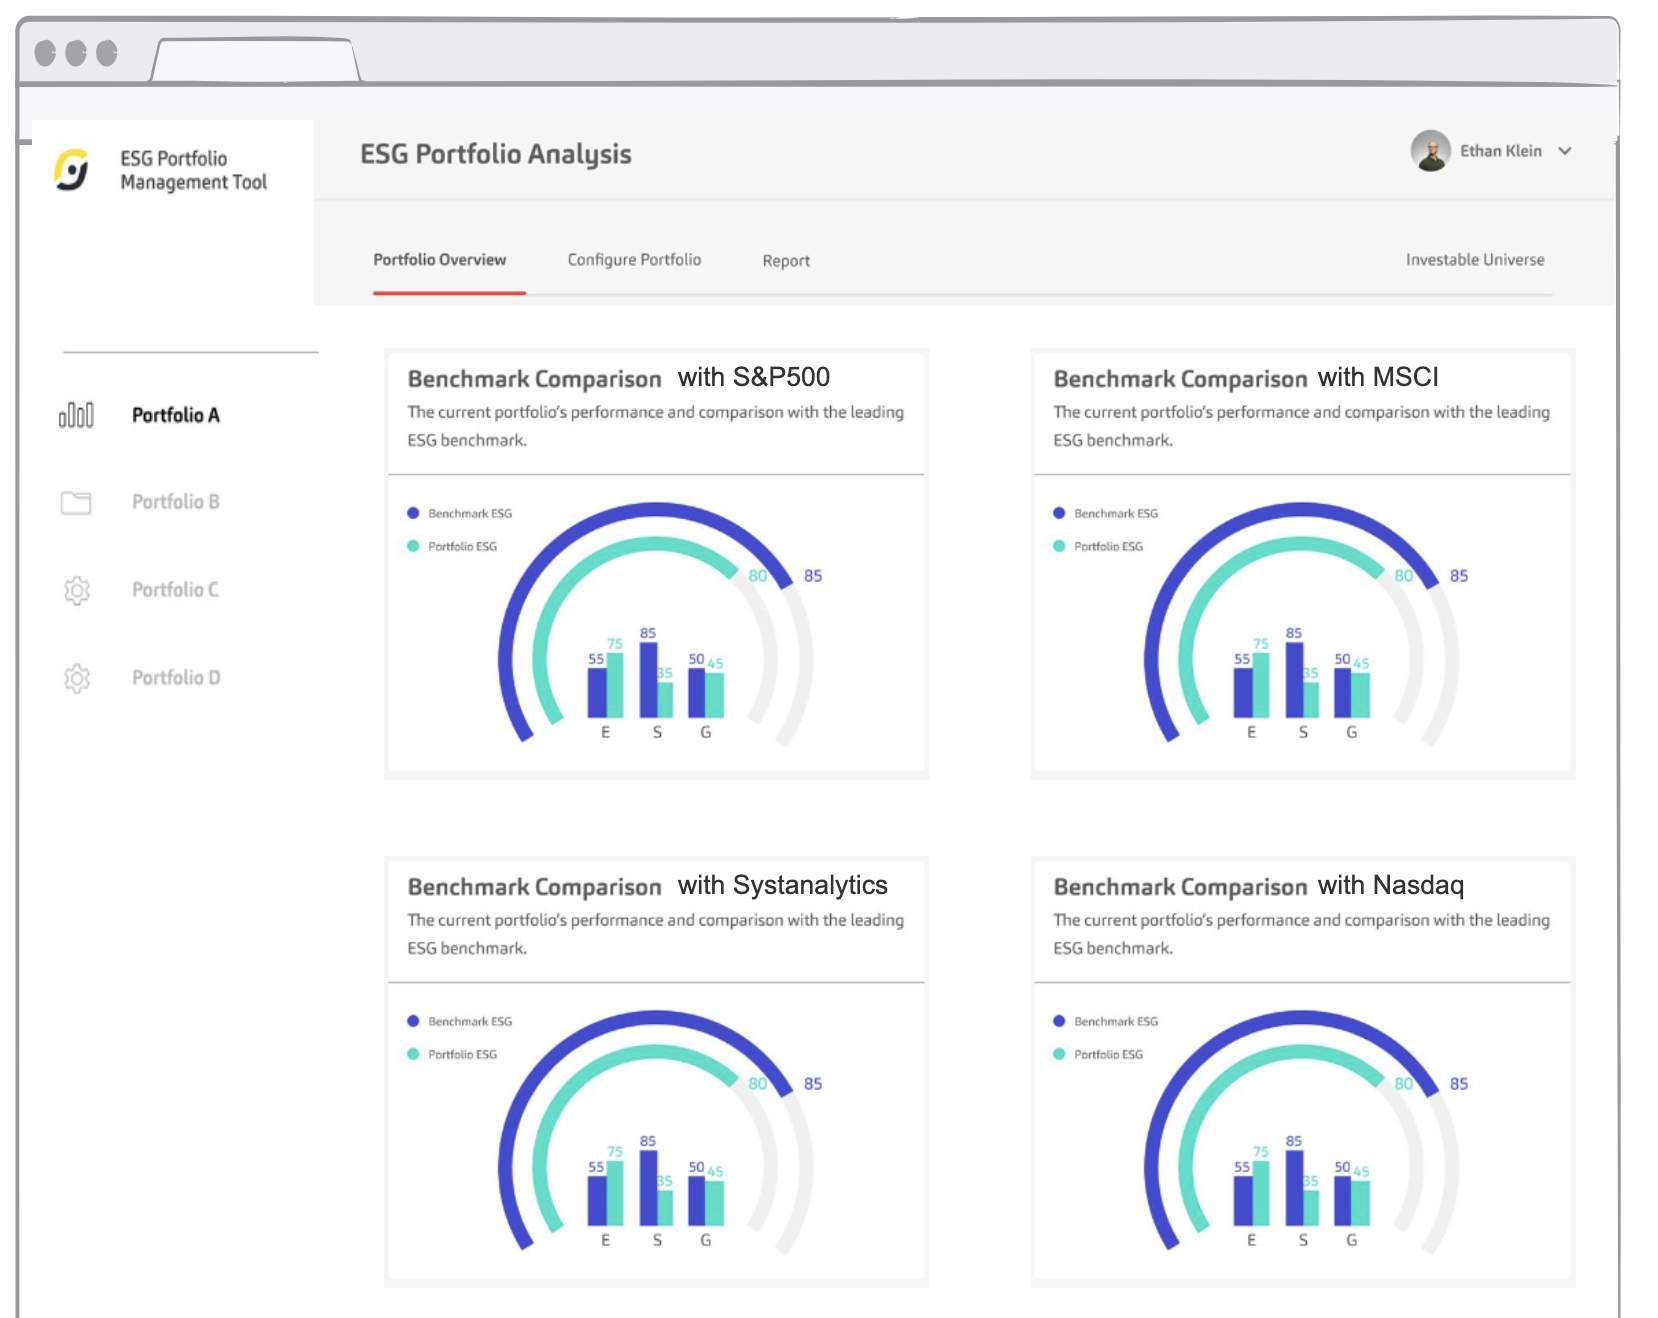
Multi-vendor ESG scores benchmarked side-by-side against sector indexes in a single view.
Algorithm suggests an alternative portfolio with the minimum number of swaps needed to hit a target ESG rating.
Client preferences are inputs to the model. Exclusions, sector caps, and risk bands shape every recommendation.
One-click export produces a client-ready report covering rationale, trade-offs, and projected ESG lift.
Research & Discovery
What advisors actually needed
Insight 01
Trust the math, but show the work
Advisors wanted algorithmic recommendations they could defend in front of a client, not a black box. Every swap had to come with a clear "why".
Insight 02
Minimal disruption beats maximum score
A perfect ESG portfolio is useless if the client refuses to sign off. Advisors valued the smallest possible set of changes that still meaningfully moved the rating.
Insight 03
The conversation, not the dashboard, is the deliverable
Advisors live in client meetings. The platform had to produce something tangible, a report that translated complex analysis into a story a client can follow.
Key Design Decisions
Three choices that shaped the product
01
Side-by-side, not before-and-after
Rather than swapping the current portfolio for the alternative, the dashboard shows both at once holdings, ESG scores, sector exposure, and risk metrics aligned row-by-row. Advisors can scan the deltas at a glance and only drill in where something looks off.
02
Preferences as first-class constraints
Client preferences, exclusions, sector caps, ESG priorities, risk bands sit at the top of the simulator, not buried in settings. Changing a constraint immediately re-runs the recommendation, so the advisor sees exactly how each guardrail shapes the outcome.
03
Report as the natural endpoint
Every screen in the flow contributes to the final report. By the time the advisor clicks Export, the rationale has already been written, they're curating, not authoring. The report becomes a by-product of the analysis, not a separate task.
Design iterations
Defining the interaction model
The goal of the design was to create an interaction model that allowed users to view meaningful contextual data.


Design Walkthrough
From portfolio in, to report out
The advisor moves through four core moments: understanding the portfolio, tuning the simulation, comparing the alternative, and exporting the conversation piece.
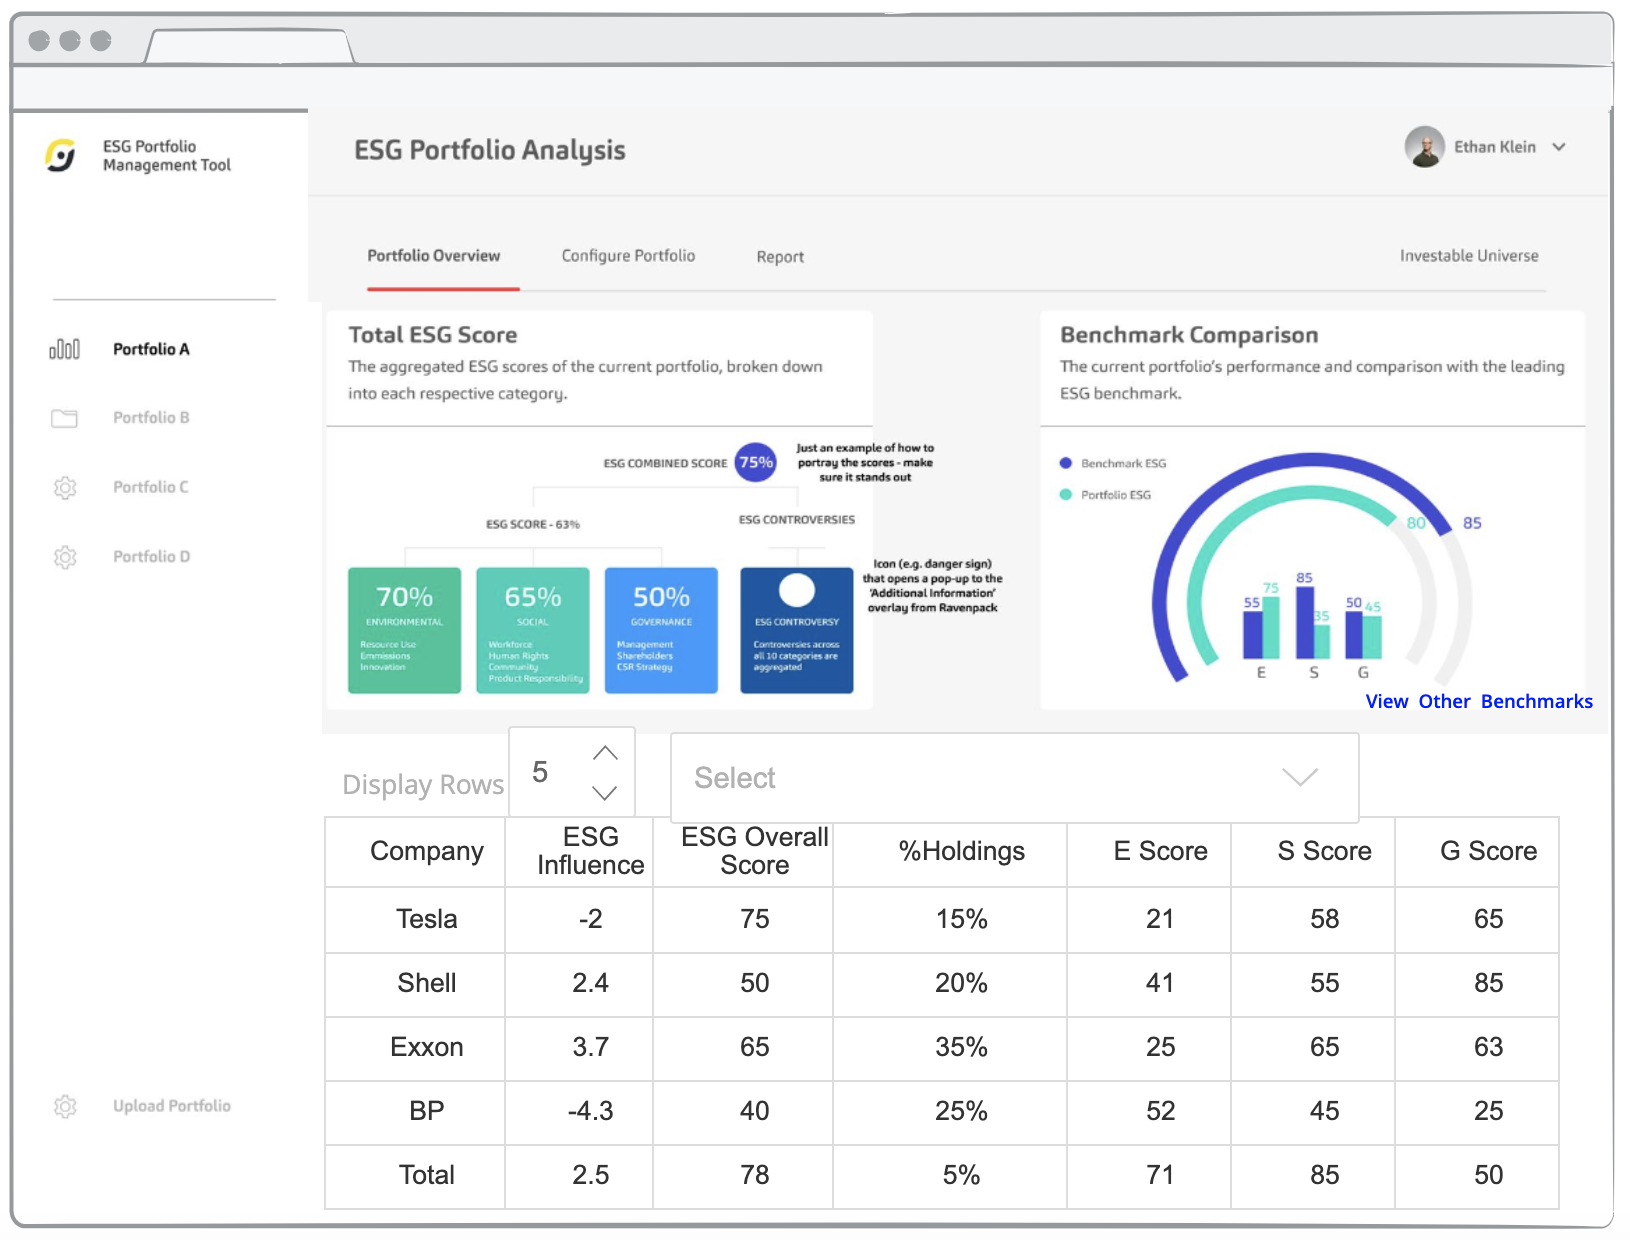
Portfolio Dashboard
Users can view the health of their portfolio based on the total ESG score, comparison of their portfolio against other benchmarks and their portfolio performance based on highest or lowest ranking companies.
Company Analysis
Review overall ESG Score for each company. Each category is broken down for a granularity. For instance, we can see how the Environmental score is broken down further to resource use, emissions and innovations.
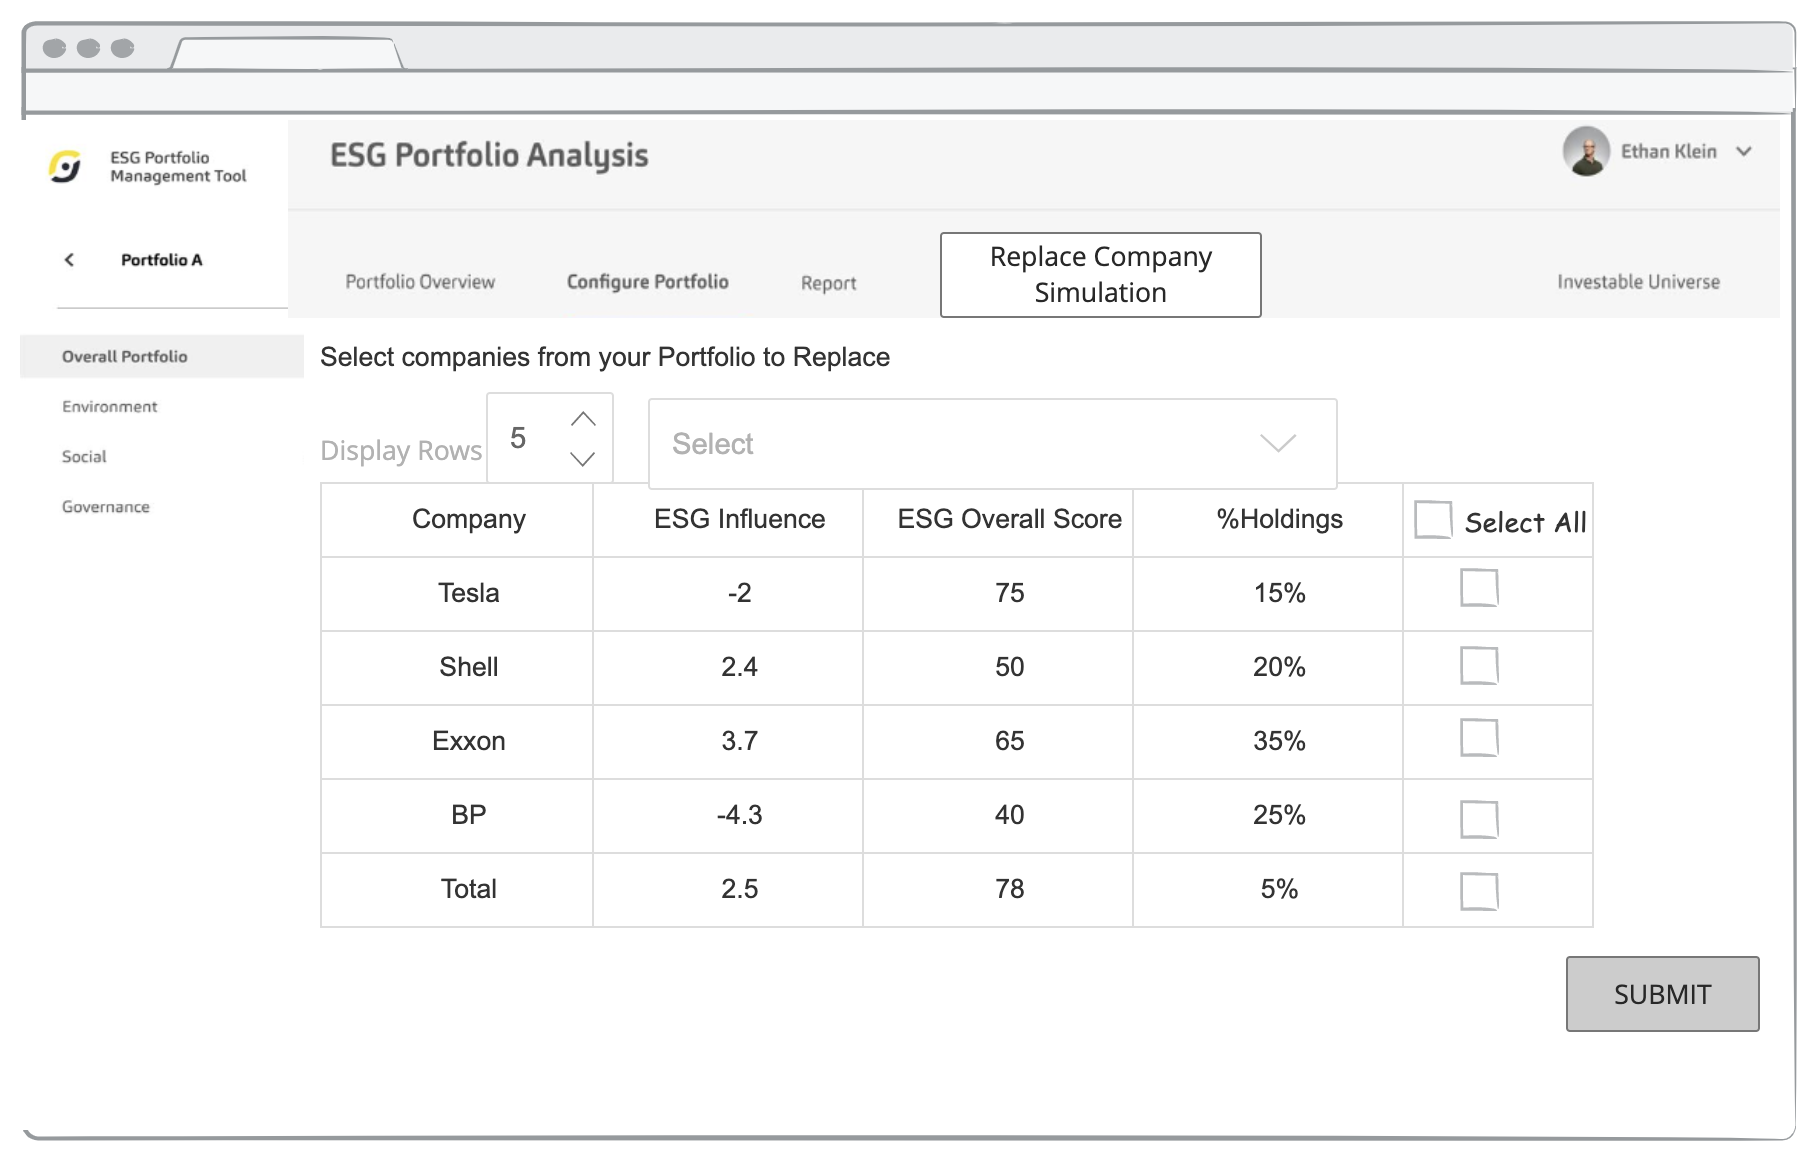
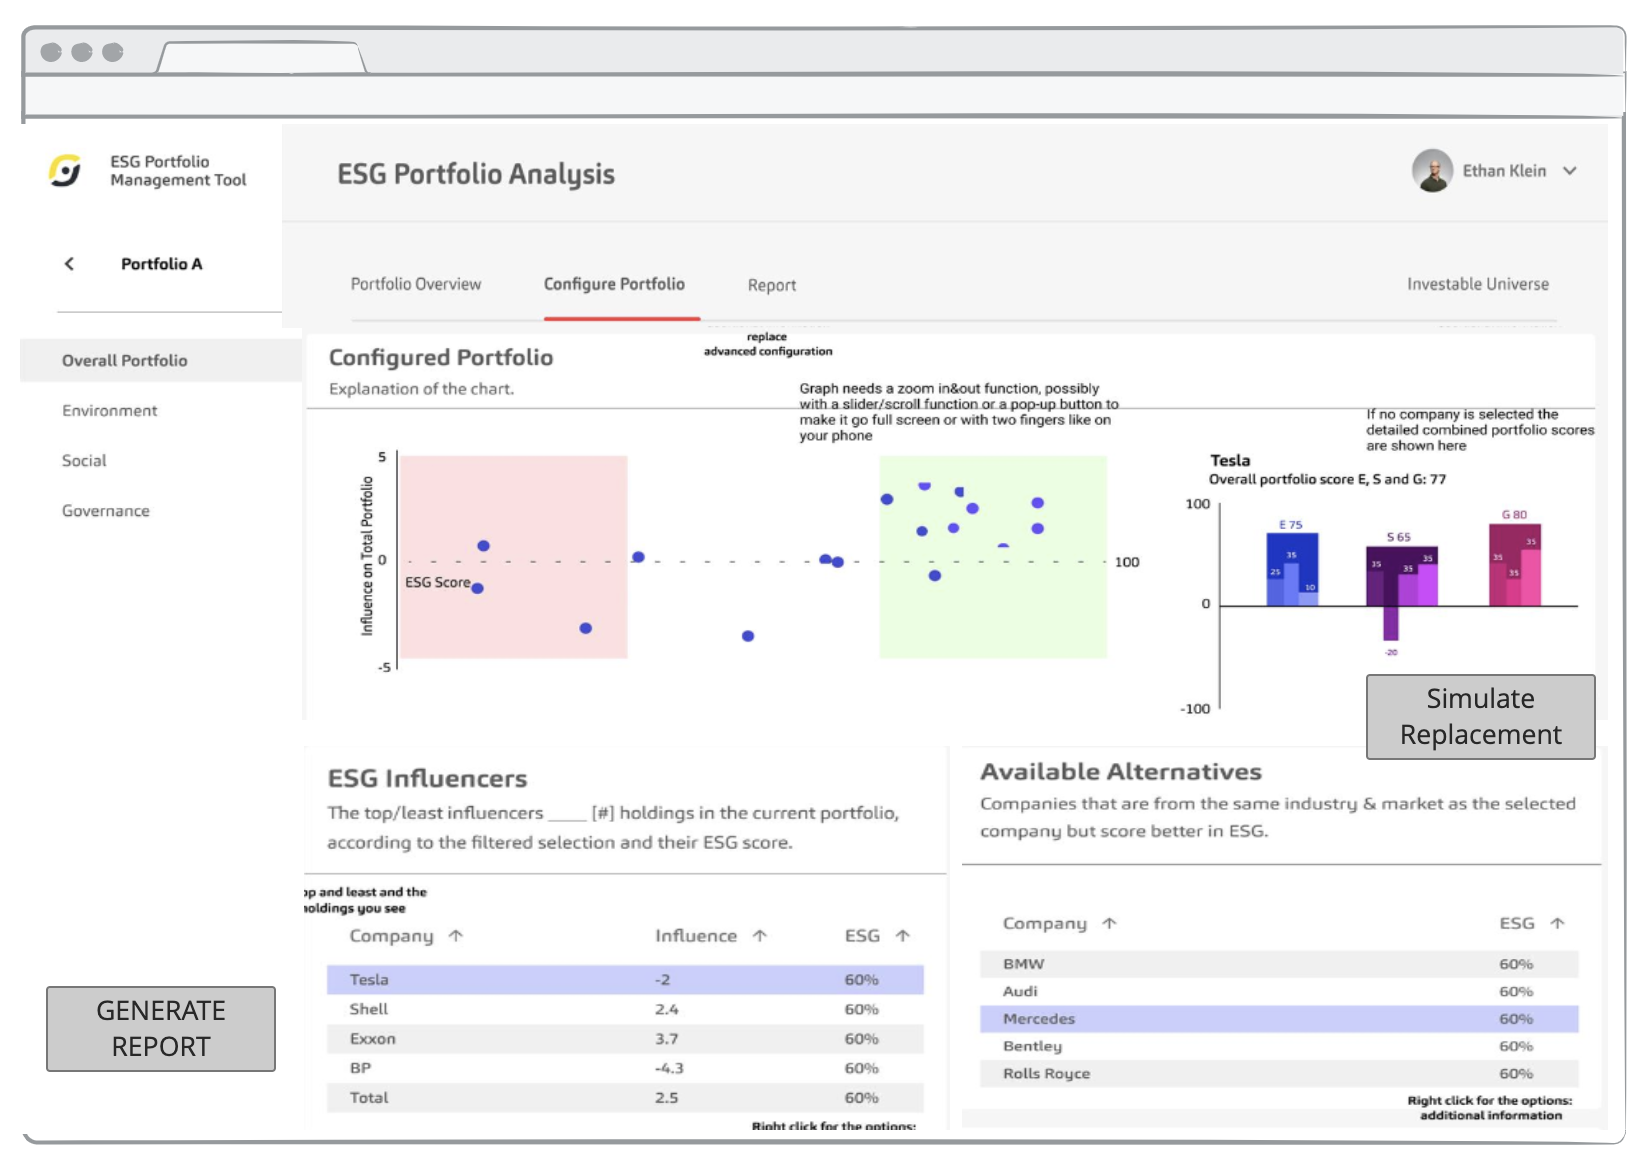
Swap Companies
If there are companies that have a lower ESG score, we can find alternative companies to replace poor performing ones based on sector and industry. The system is smart enough to find other company in within the same sector.
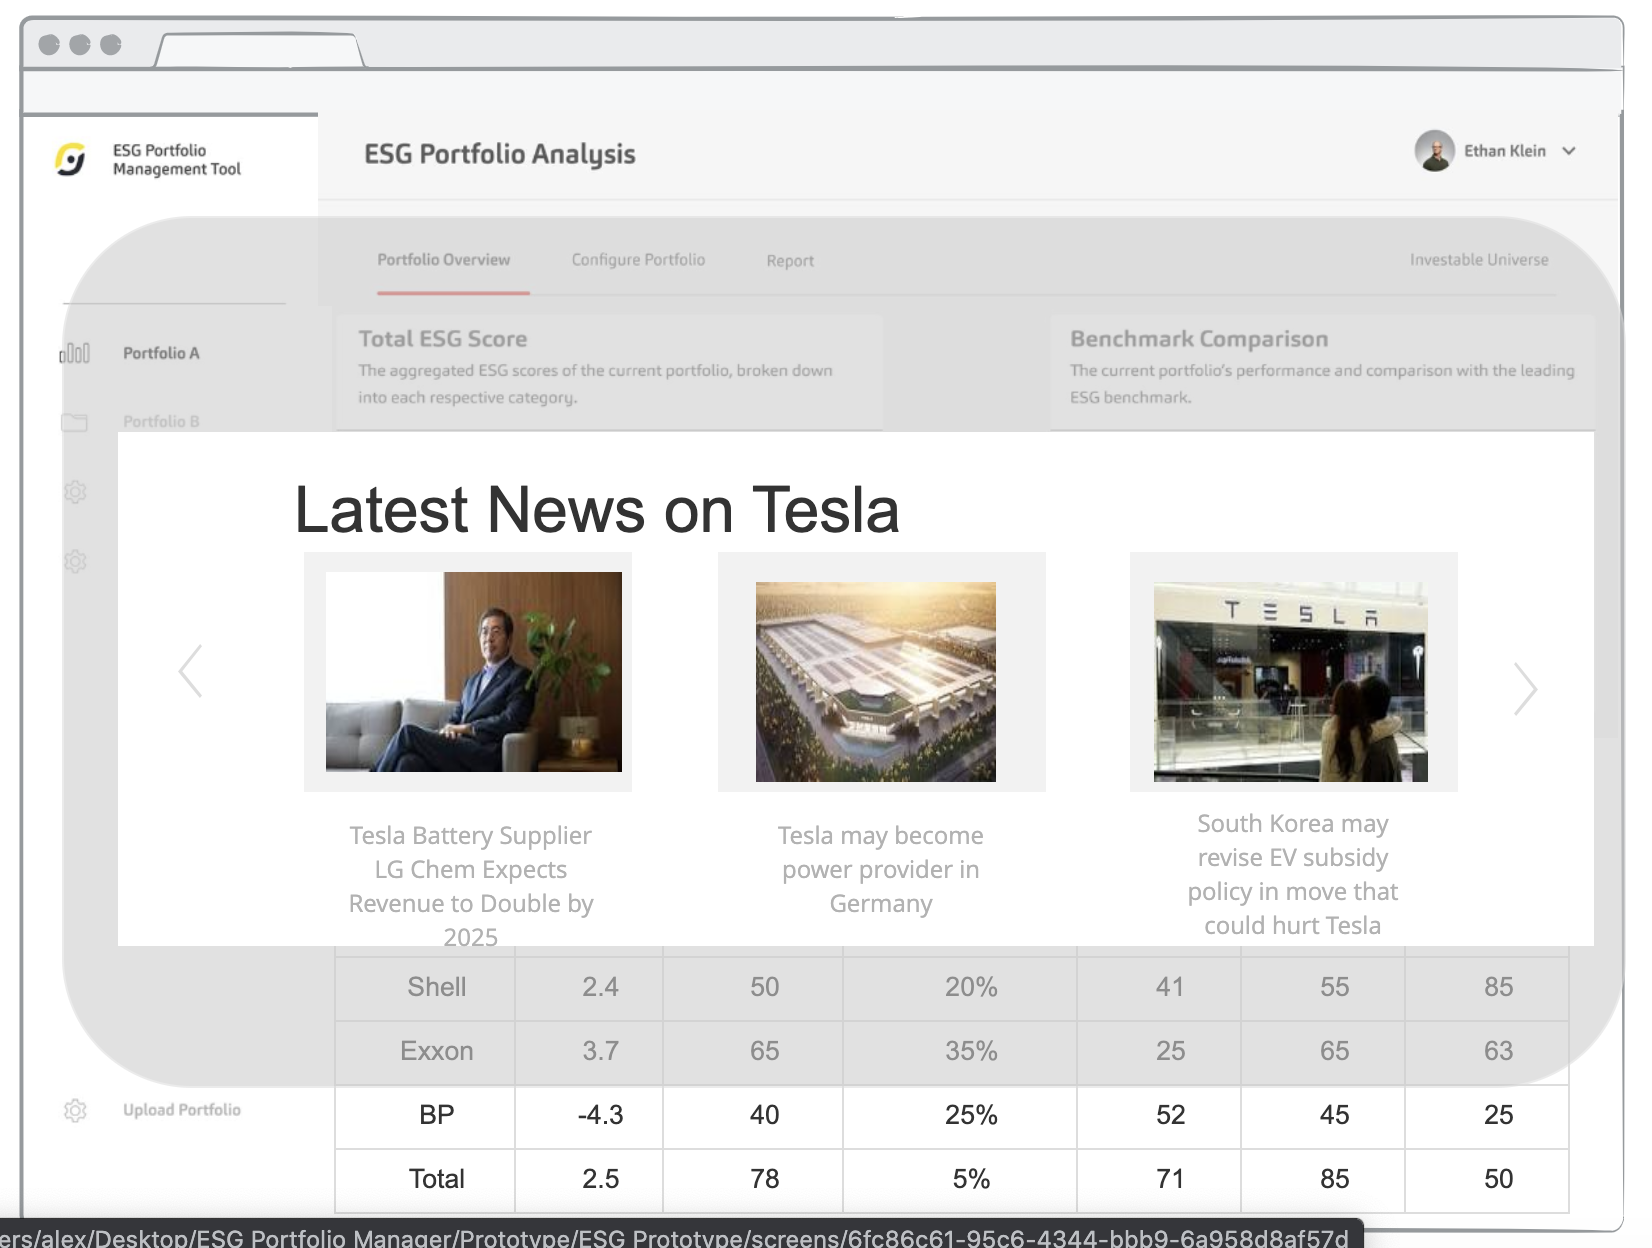
News & Events
News sentiment has a direct impact on the ESG score. Review which new articles are having the greatest impact on the performance.
Forecasting
Projection of portfolio’s performance based on the list of companies.
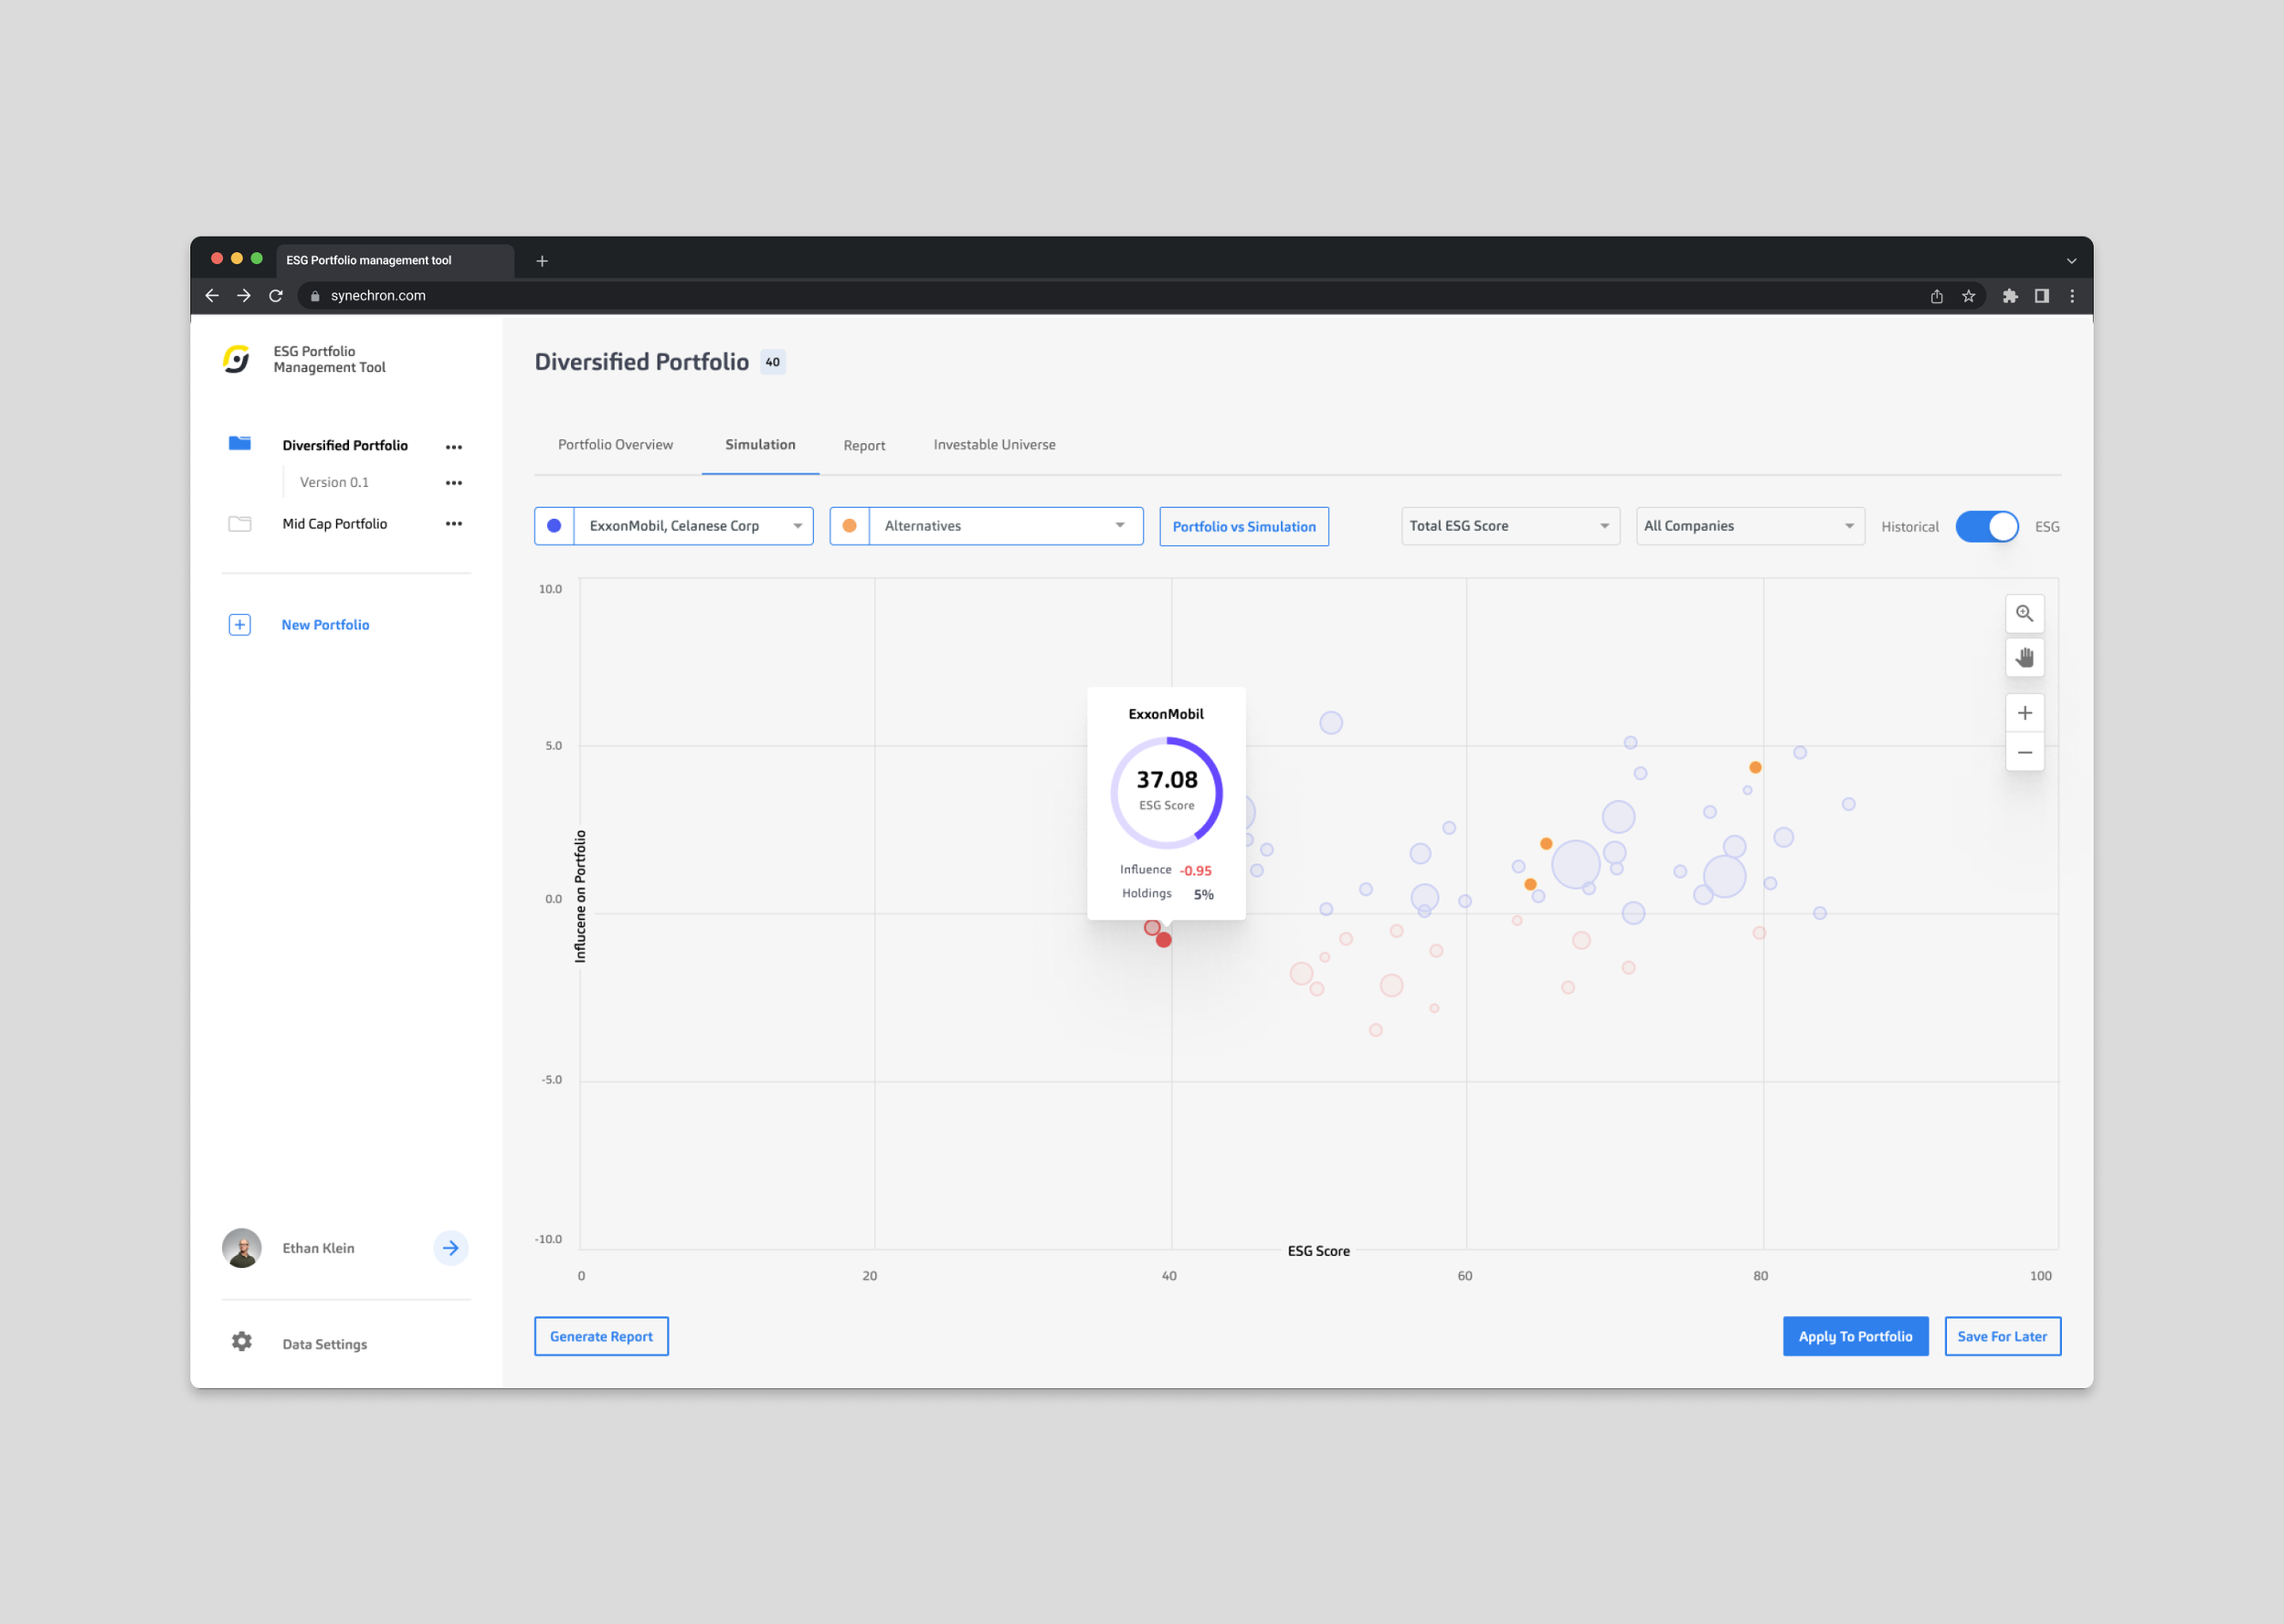
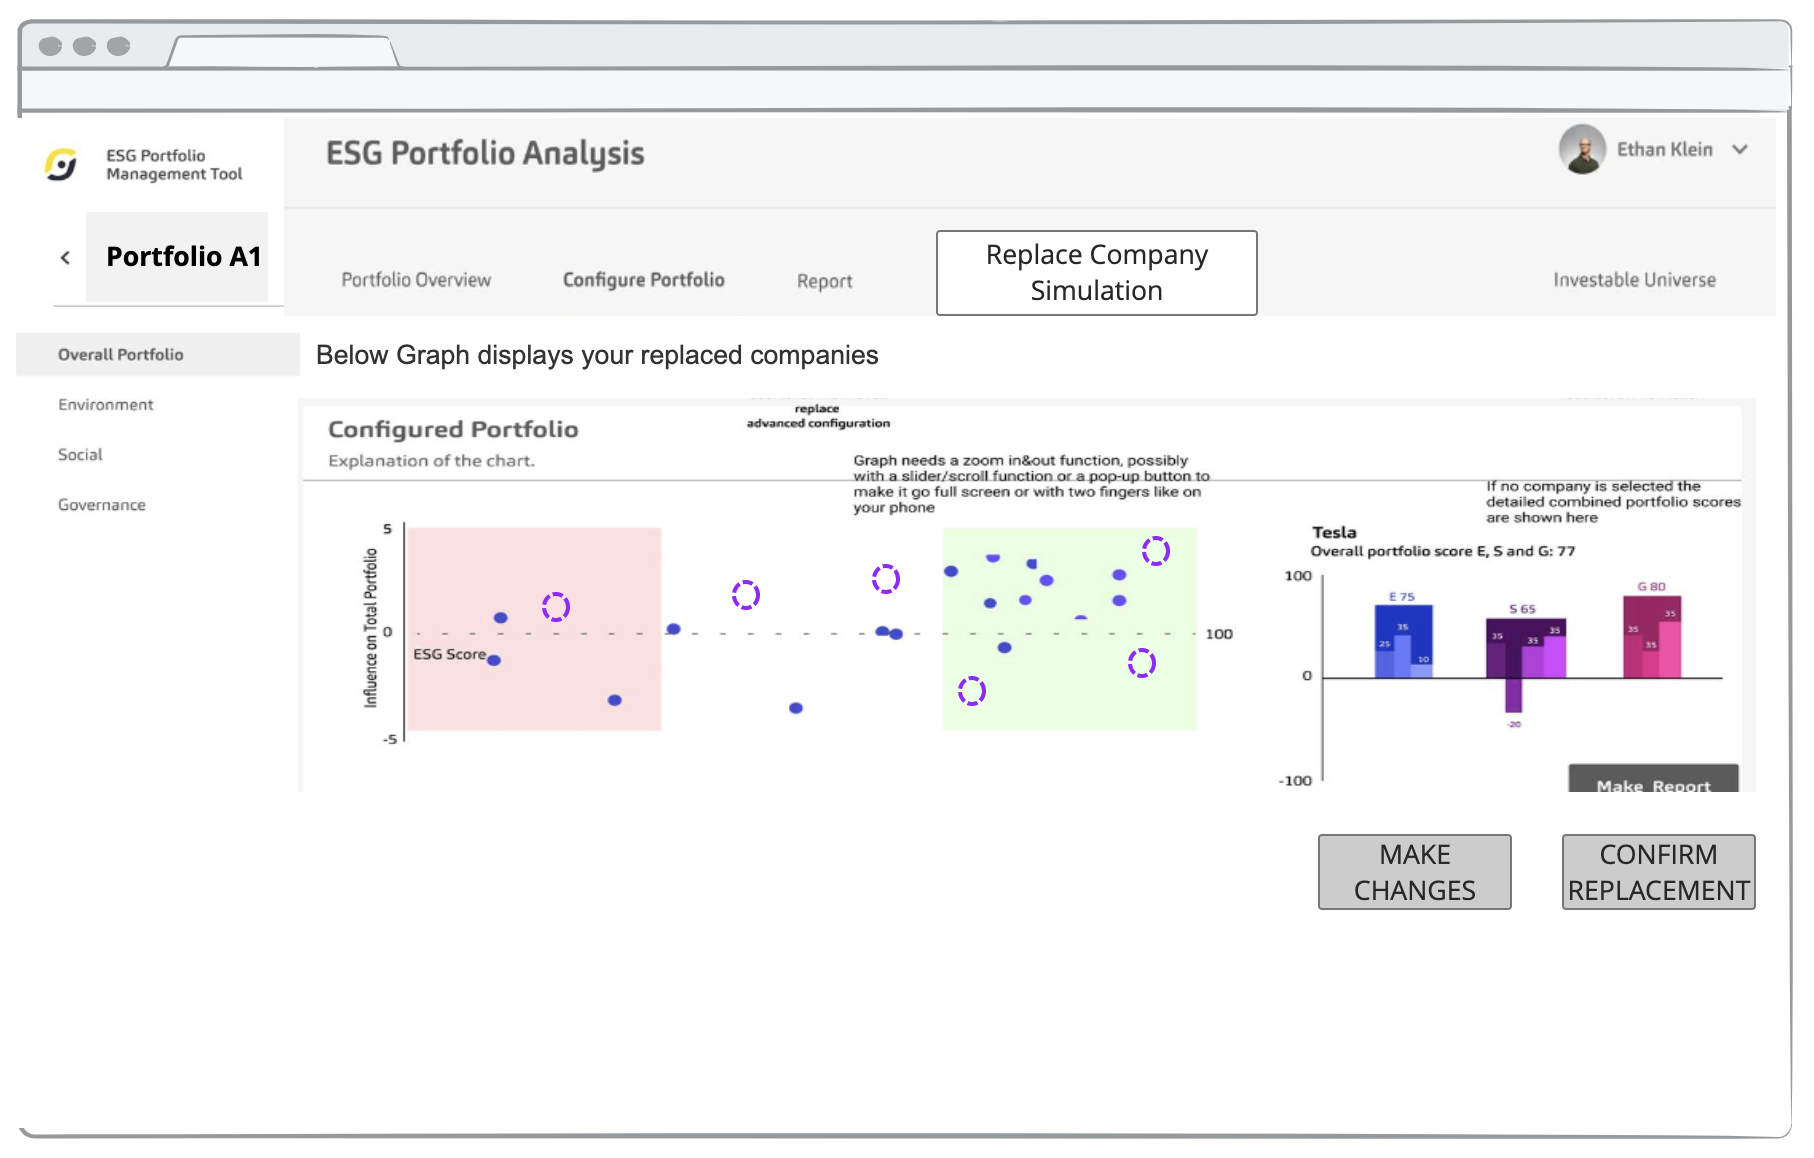
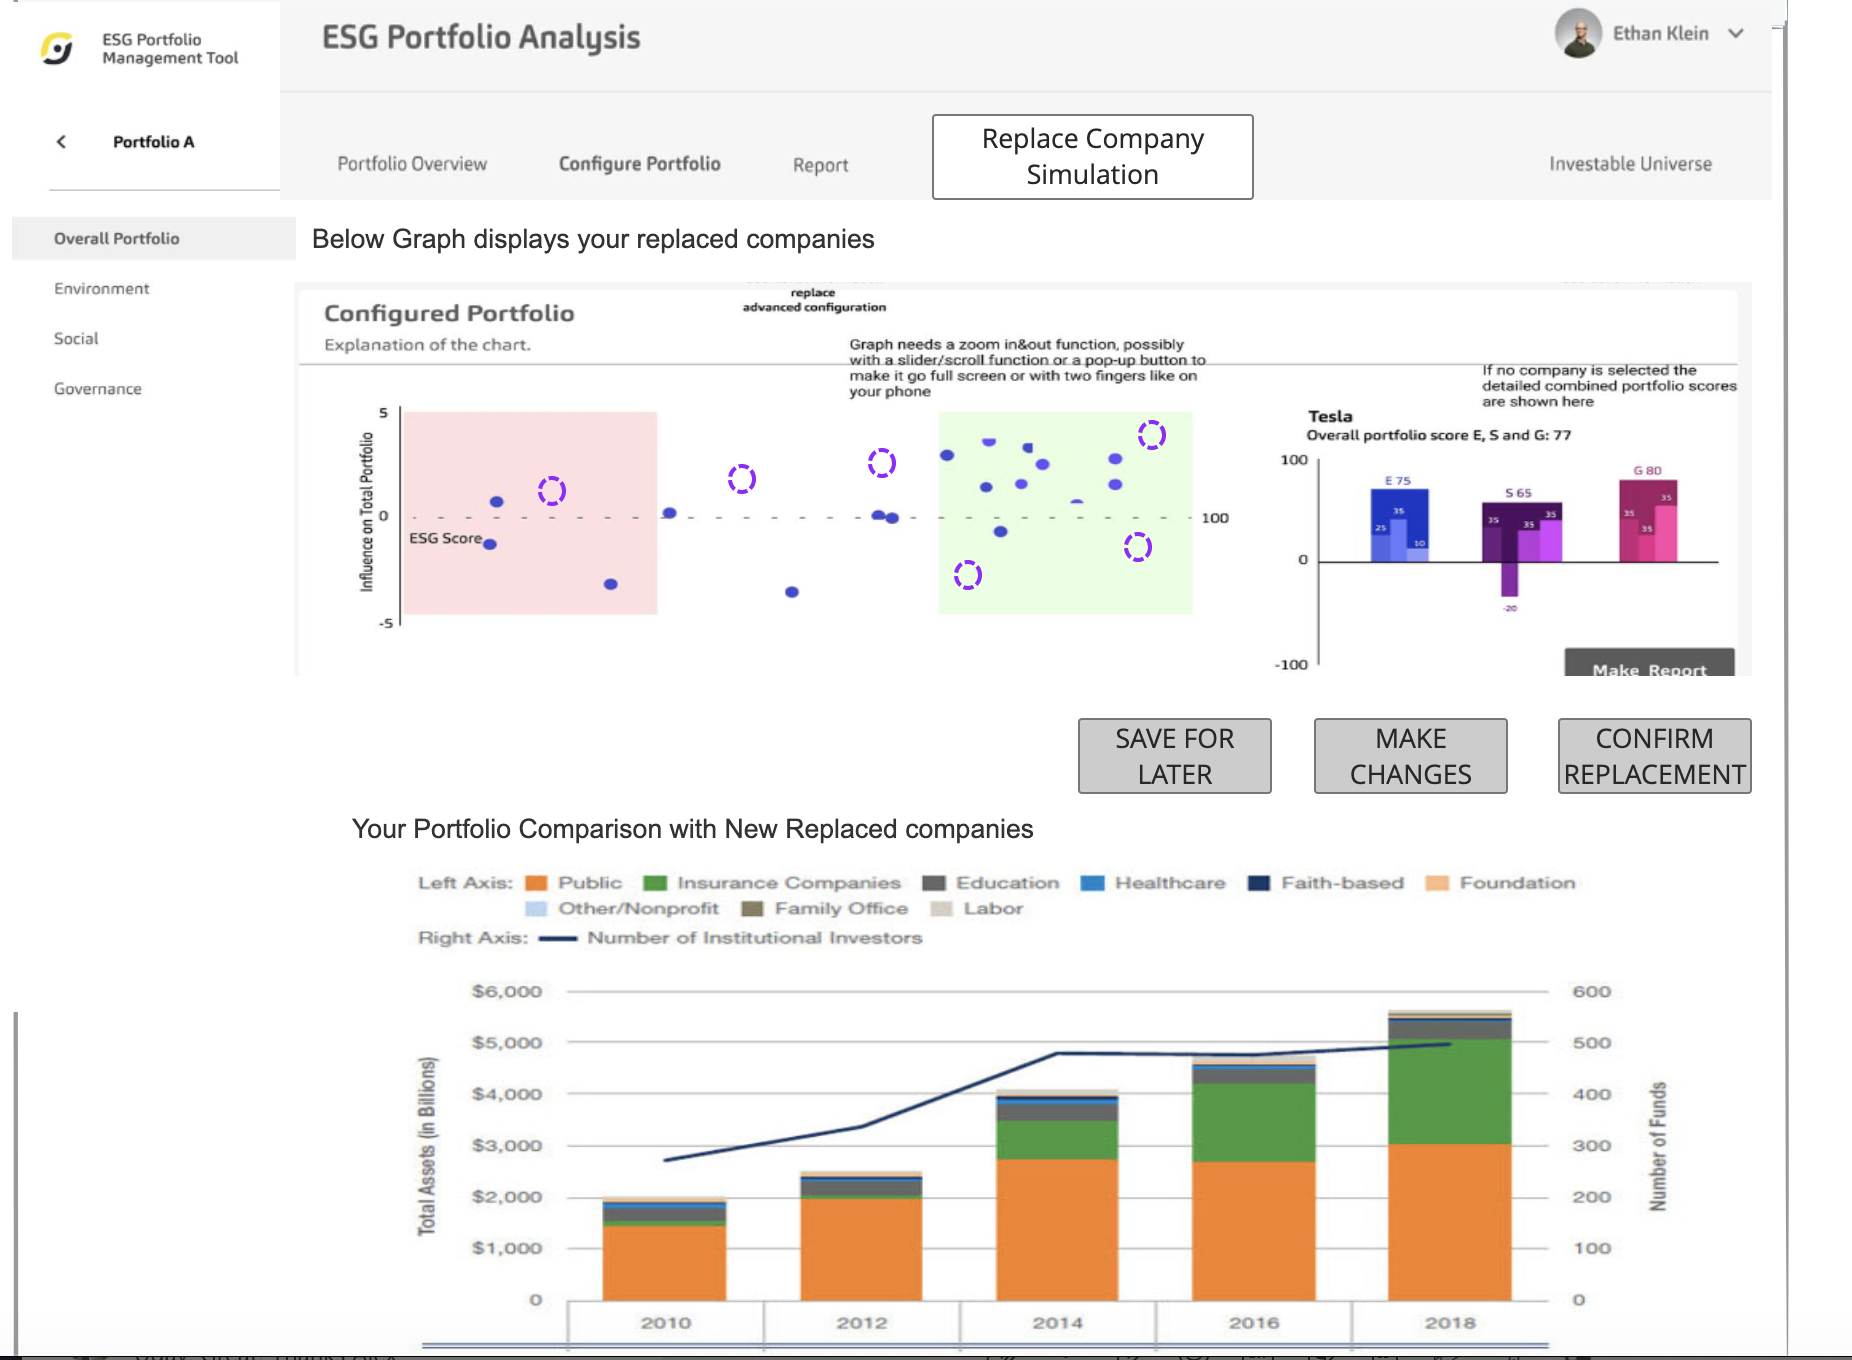
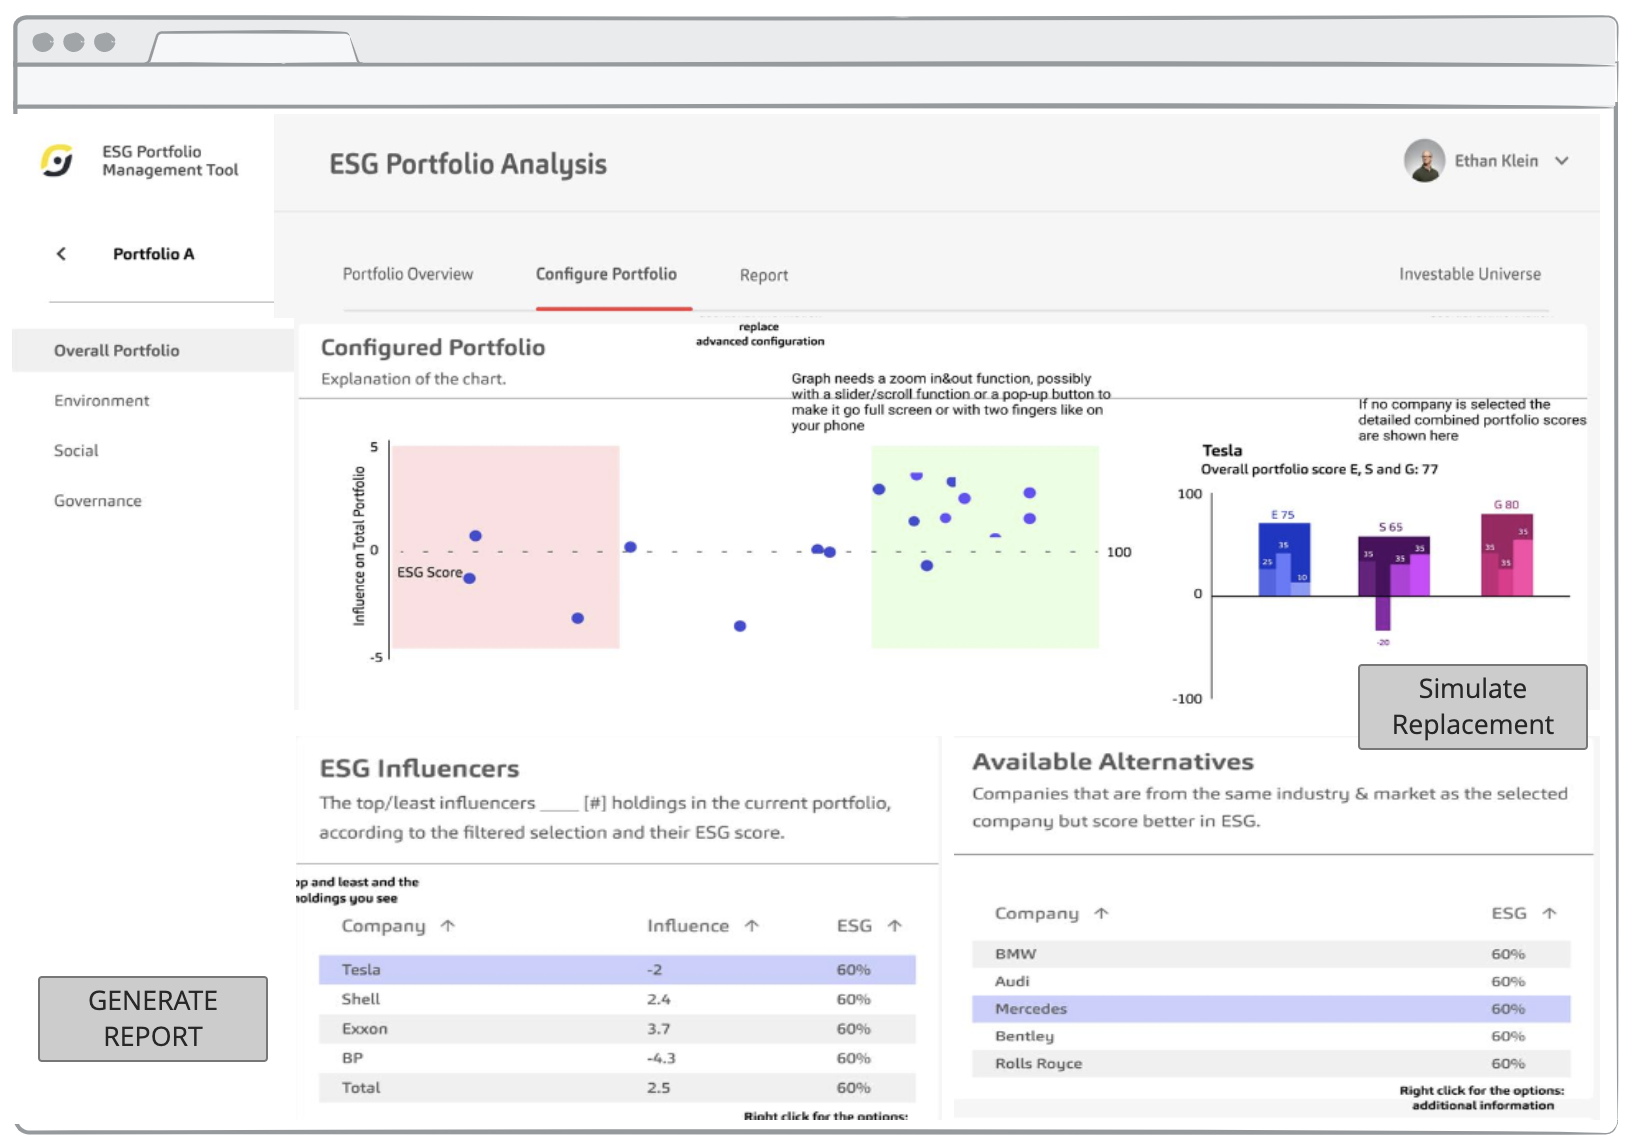
Simulating Company Swaps
Simulation helps portfolio managers simulate what the performance of their portfolio could be if they replace poorer performing companies with higher performing ones. Simulating helps visualize a hypothetical scenario before applying real changes.
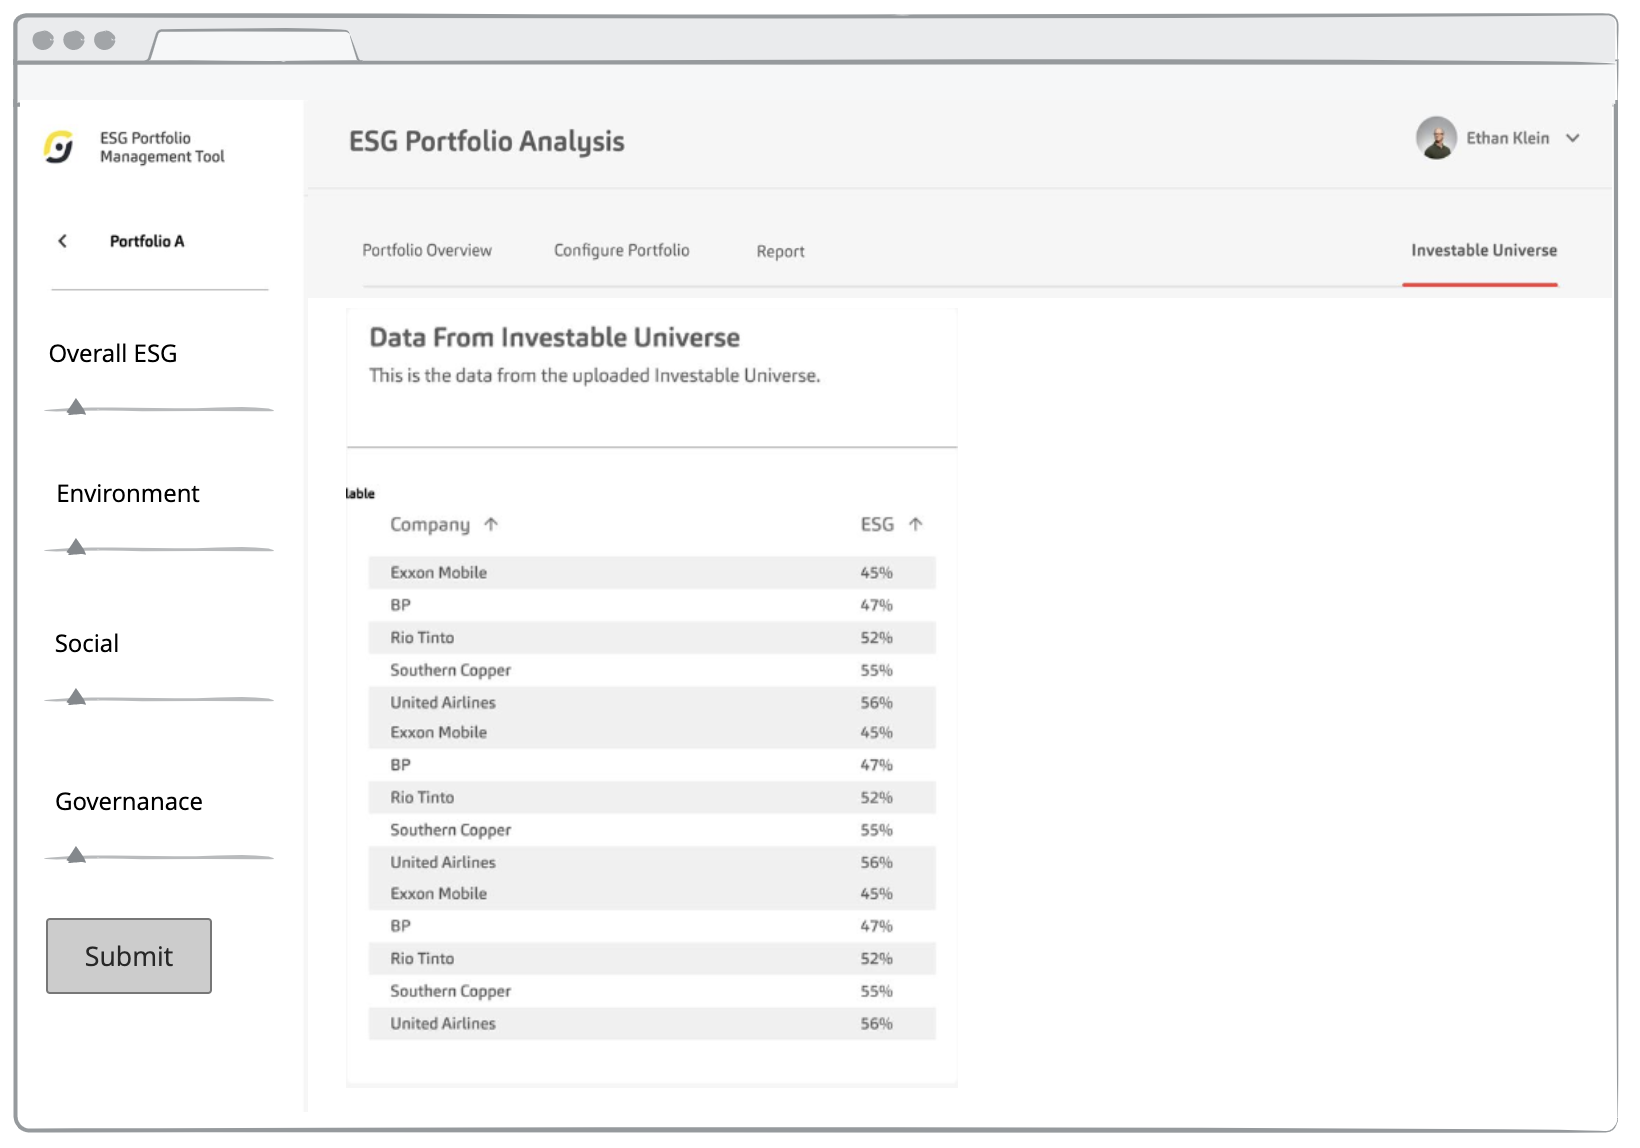
Investable Universe
The database on companies are fed to the investable universe. Portfolio manager’s can help filter down the list of companies based on the ESG performance they are setting for.
Project Outcomes
Results & Impact
ESG Booster shipped out of the Synechron Innovation Lab Accelerator as a demonstrable platform for wealth-management clients exploring sustainable investing offerings.
Accelerator
Selected for Synechron Innovation Lab showcase
Faster
Portfolio ESG analysis vs. manual spreadsheet workflow
Client-Ready
Exportable reports replaced ad-hoc slide decks
Defensible
Every recommendation backed by rationale and constraints
Learnings
What this project taught me
Designing for an advisor's workflow is really designing for a conversation. The platform doesn't end at the dashboard it ends in a client meeting. Anchoring every design choice to that downstream conversation kept the product focused on usefulness over completeness.
In a domain as data-dense as ESG, restraint is its own feature. Showing fewer, better-framed numbers and explaining the deltas, built more trust than wall-to-wall dashboards ever could.
The Innovation Lab Accelerator format also reinforced how valuable rapid prototyping is when designing against an unfamiliar domain. Putting clickable artifacts in front of portfolio managers early surfaced misunderstandings that no spec document would have caught.